Key Environmental Factors for Assistive Navigation: A 20-Year Scoping Review
 Photo by Nadiia Doloh on Pexels.com
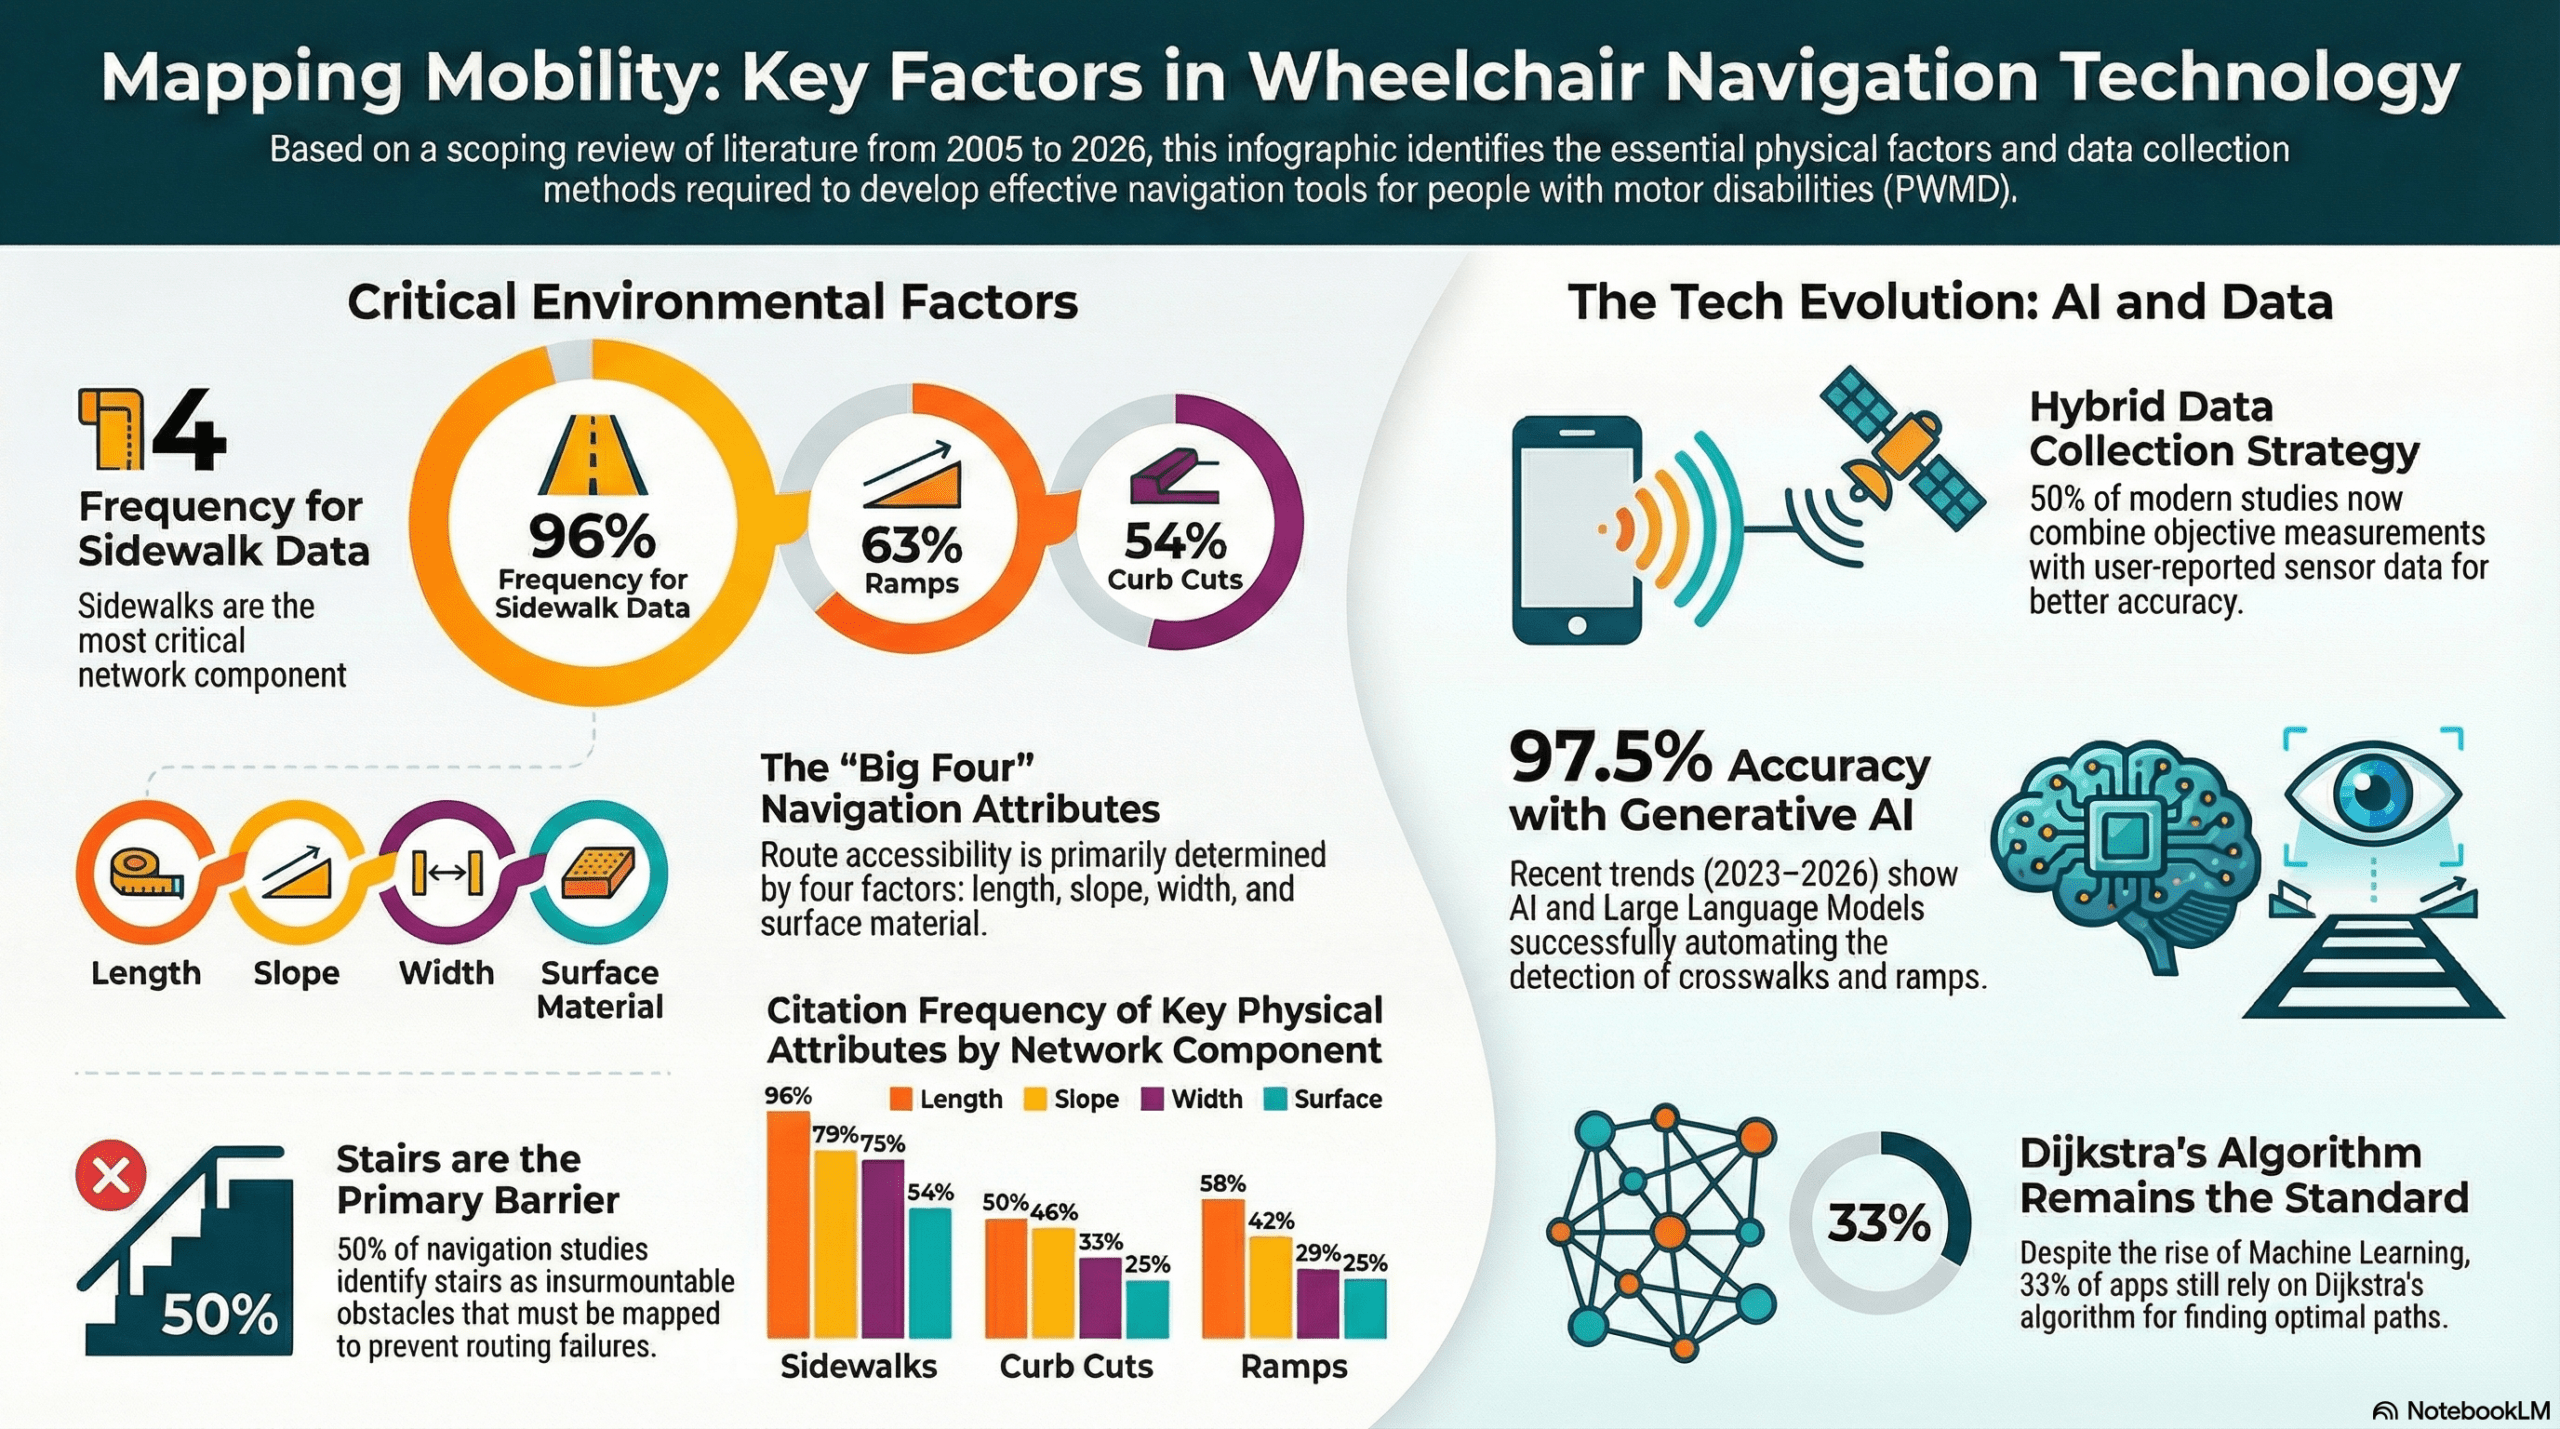
A recent scoping review published in the International Journal of Geo-Information provides a comprehensive analysis of the environmental factors essential for inclusive wheelchair navigation. By examining two decades of research, the paper highlights a significant shift from “pass/fail” accessibility standards toward a more continuous, personalized approach. While physical features like sidewalk width (75%), slope (79%), and the presence of ramps (63%) remain the most documented factors, the study emphasizes that true mobility depends on the complex interaction between these static elements and the user’s individual capabilities.
The research underscores an exciting evolution in how we collect and process accessibility data. While 50% of analyzed studies still rely on traditional, manual measurements, the latest research from 2023 to 2026 demonstrates a surge in the use of Artificial Intelligence (AI) and machine learning. For instance, modern tools now use smartphone sensors to automatically classify surface vibrations or generative AI to detect crosswalks from satellite imagery with a remarkable 97.5% accuracy. This technological leap allows for the integration of real-time “dynamic” factors—such as weather conditions or crowd density—that were previously too difficult to track.
This information is incredibly valuable for urban planners and city authorities who are tasked with designing more inclusive environments. By targeting the specific factors identified—such as the length and surface quality of sidewalks—they can move beyond basic compliance and prioritize infrastructure upgrades that have the highest impact on daily social participation. Furthermore, software developers and engineers can use these findings to refine routing algorithms. Instead of just offering the shortest path, they can implement multi-objective models that account for a user’s confidence levels and energy expenditure, effectively avoiding obstacles that would otherwise be insurmountable.
Healthcare professionals and rehabilitation specialists can also utilize these insights to better understand how environmental barriers interact with a patient’s skills. By integrating these environmental metrics into clinical tests, they can provide more realistic training and guidance for wheelchair users navigating unfamiliar urban settings. Ultimately, the data serves as a roadmap for creating a more seamless, multimodal mobility experience where pedestrian networks and public transit work together to support independence.
In conclusion, this scoping review serves as a vital bridge between theoretical accessibility standards and the lived reality of wheelchair users. By embracing AI-driven data collection and personalized routing algorithms, we can transform urban centers from obstacle-filled landscapes into inclusive spaces that foster social participation. As technology continues to bridge the gap between human capability and environmental barriers, the vision of a truly accessible city becomes an attainable reality.
PS: Don’t have time to read the scoping review? Take a peek at the infographic below to get some key insights. (Generated by Google’s NotebookLM)
Leave a comment